

This is part 5 in the Multifamily Underwriting Series. If you haven’t done so, go back to post one, two, three, and four before reading this one.
By now you have gathered all the information and can start crunching the numbers, my favorite part. No really, I’m a weirdo. I love spreadsheeting. Hopefully you do too. If not, you may want to find a friend to help or outsource it. If you don’t do this well, you can set yourself up to have some major problems.
I’ve evolved a spreadsheet over many years to help with this process. Send me an email if you want me to send you a copy. It was started largely from information in my favorite real estate book, The Millionaire Real Estate Investor, by Gary Keller and Jay Papasan. It’s changed a lot now. Let’s get started with a look.
The Columns
First, have a look at the column headers. The first actual column is the Pro Forma. This is all the information provided by the seller as the ‘best case’ scenario. Sellers often provide this in their publicly-available packet of information. It’s the rosiest picture. I don’t use it to do my valuation, but it is valuable to have here for comparison. With this, when you go to negotiate you easily can show them where their numbers are wrong.
The next column is the T-12, which stands for trailing 12 months. This is a profit and loss statement brought as up to date as possible, rather than using a calendar year. This information will be more true to actual than the pro forma, but often there are details that are left out (whether intentionally or not), mainly in the expenses.
The next column is ‘My Numbers’. These are going to be estimates based on my previous experience. For instance, if the seller didn’t have a line item budget for landscaping, I’m going to put one in there. Maybe they thought it was fine to have weeds growing everywhere, but I don’t, and I definitely will have this expense, so my purchase price needs to reflect that. If the seller disagrees, we won’t make a deal.
Finally, we have the Expense Ratio column. This simply estimates the value based on whatever expense ratio I predict for this property. I conservatively estimate 45%. Use your historical numbers in properties you own in the area if you can, otherwise 50% is a good start. This is pretty high and means you will turn down some good deals, but that is better than taking a bad one when you are starting.
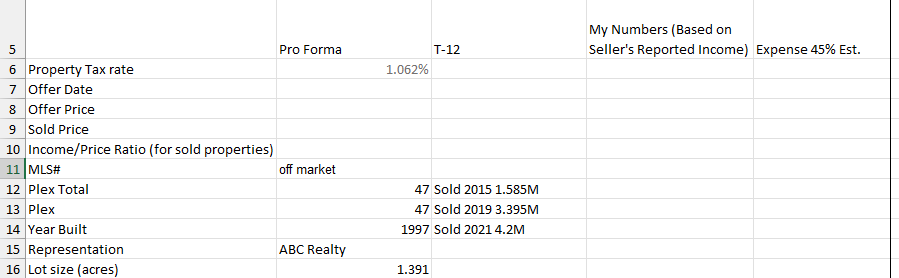
Next, put in a bunch of demographic data to help you when you are looking back at this in the future.
The lion’s share of the income is from the rent and so I have a section devoted to rent. I’ve removed some rows in the table below so it’s easier to read.
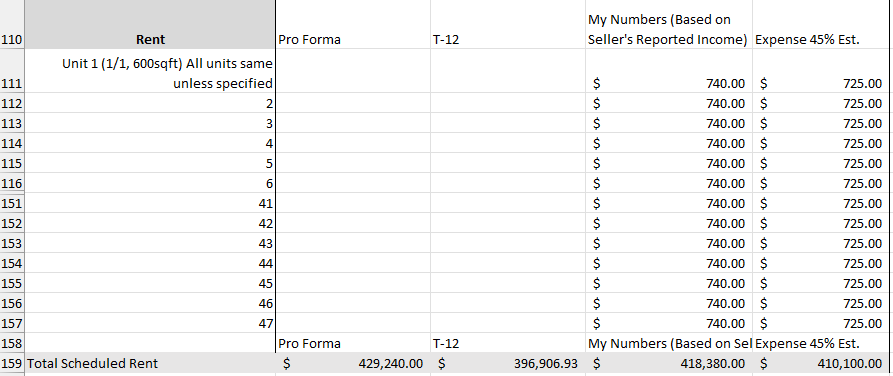
Notice how the Pro Forma and T-12 have nothing listed until the bottom? It’s because they often just give you a line item for rents collected and not for the individual units. You’ll want to put in your expected numbers on the third and fourth columns for each unit, as they won’t all be the same. How do I arrive at this number? It’s the market research I did in a previous step. I also combine that with some intuition on what the seller is getting for rent in the rent roll:
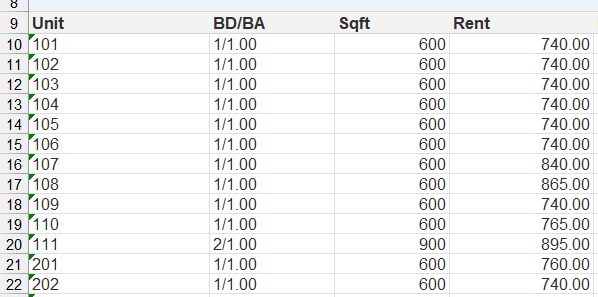
This is just a snippet of the rent roll for a fictitious deal. Notice how the rents are all over the place for the same size units? I call that the rent spread and it may mean a few things. It might mean that they have been keeping tenants on long-term (usually you can find this in the rent roll) and not raising the rent to keep up with the market. It might mean they are adding pet rent or garage rent into the numbers here, which they shouldn’t do (some tenants don’t have a pet, so their rent will be less in that case). A big rent spread is usually from lazy management and I like that because I can quickly raise rents and add value. Taking out the outliers and that one odd 900sqft unit, I have $747 per month average. I’ll round down to $740 to be conservative. Which is why you see $740 for all my units on the above Rent screenshot.
Once you put all the numbers in, you’ll get a bottom line rent income. That gets populated in the Income area as Scheduled Rent (the rent you’d expect to get in a perfect world with no vacancy).
Vacancy
Let’s talk about vacancy. Vacancy is the lost $ because someone wasn’t there (physical vacancy) or wasn’t paying their rent (economic vacancy). It is a loss of income. It is not an expense, which is why it is up here. That is money that never came in, so it is debited from the income.
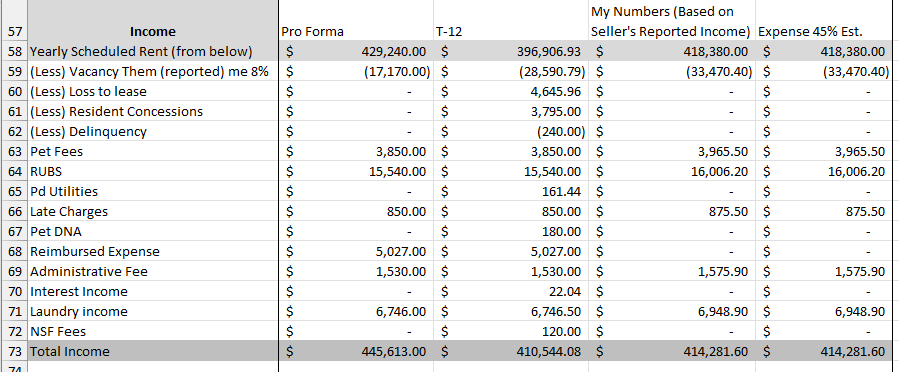
You may notice in the T-12 that Loss to Lease and Concessions are positive. Concessions should never be positive and I suspect this is a mistake, but I will always put their numbers down verbatim and put in the ‘right’ numbers on the My Numbers column (Its $0 for me because I rarely do concessions). Loss to Lease is the $ off of market rent. It should be negative, because most sellers will claim they are below market rent and try to sell the place based on what it could be. Loss to Lease can be positive, if your rents are above market. But then, the buyer has to ask ‘why?’. Why would a tenant possibly be paying above market? Is there something special about these units? Also, it’ll be hard to grow rents in the future because they are so high right now. Delinquency is economic vacancy and I lump that into my standard 8% vacancy. This is high for my area, but I think it is right based on our vacancy rates and my economic vacancy rates. Yours may be different. I take 8% of the scheduled rent for vacancy.
Additional fees can be put in here as well. There is some controversy about putting in pet rents and late fees. Really, you should have only the numbers in which you are confident. I know that laundry income will continue and should grow by 3%, so I add that into My Numbers. I know that in a sufficiently large multifamily, there will be a certain percentage of people having pets, depending on the area (do your market research). I think the sellers are pretty close in this area, so I’ve added 3%. RUBS is Ratio Utility Billing System and is a way to get paid back for the utilities for which the landlord pays. It most likely will remain the same for a while as the current tenants will continue using similar amounts of water and electricity and paying a similar amount based on their current leases. I’ll add 3% here as well.
They will often have oddball income areas in an effort to squeeze every penny of income out of that place. I remove those from my estimations unless I know that I’ll be getting that income.
At the end, you arrive at a total income line. You’ll see that there is a big difference from the Pro Forma income (445k) and the T-12 income (410k). That T-12 is similar to mine, which will cause me to question the seller about why they think that I can do so much better on income. A big chunk of it is 11k less in vacancy in their Pro Forma. That’s crazy! It’s not dishonest, but certainly not an accurate projection for a buyer.
The last column, the expense ratio, will look the same here. It will come into play later. We made it through income. This is a very important part so it is critical you double check your numbers and your estimations. You’ll want to be conservative here, siding more with the actuals than what you (or the seller) predicts you’ll get. Remember, you are buying an asset as-is. If they could have done better, they would have. There will be a premium placed for future rents, to be sure, but not yet. Next time, we will look at the expenses, the area that sellers can wiggle the most.
